
From a street address to a defensible risk rating
Every Climate Remit report is generated the same documented way: hazard science, property-specific vulnerability and exposure data combine inside our Climate Risk Engine to produce a rating you can trace back to its assumptions.
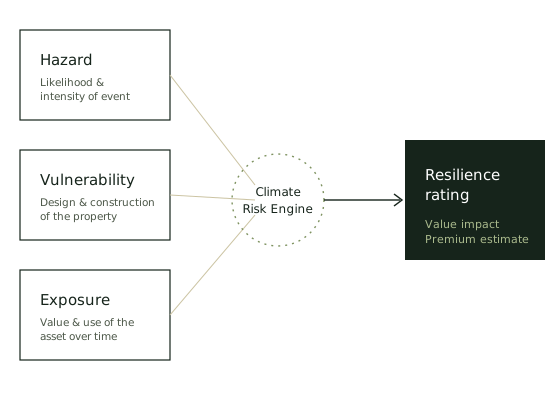
Three inputs, one rating
Hazard — the likelihood and intensity of an event at this location, drawn from national and international climate and weather datasets.
Vulnerability — how the specific building is likely to perform, based on its design, age, materials and construction standard.
Exposure — what is actually at stake: the value of the asset, and how it's used, now and over the report's projection horizon.
How a report is generated
Address & property inputs
You provide the property address and a small number of details about its construction — build year, storeys, roof and wall materials, and elevation above ground where known.
Hazard modelling
The engine pulls hazard intensity for the site across each covered peril, projected across present-day, 2050 and 2100 horizons using IPCC AR6 climate models and SSP emissions pathways.
Vulnerability analysis
Construction details are matched against fragility data for each hazard, so a raised, non-combustible home and a slab-on-ground timber home in the same street receive different results.
Exposure overlay
Current property value and, where supplied, replacement cost are layered in to translate physical risk into financial terms.
Rating & report generation
Results are compiled into a resilience rating, a technical premium estimate and a climate-adjusted value, with the full hazard-by-hazard breakdown, and delivered by email.
Six outputs, one report
Climate resilience rating
A single summary rating indicating the property's likely future insurability and value stability across three points in time.
Technical insurance premium
An estimate of the annualised average cost of damage the property is likely to sustain from extreme weather and climate-driven hazards.
Climate-adjusted value
The estimated reduction in value for this property, relative to an equivalent property that isn't exposed to the same hazards.
Individual hazard risk
A breakdown of how much each hazard — flood, fire, wind, soil movement, sea-level rise — contributes to the overall risk profile.
Vulnerability diagnostics
Which elements of the property — roof, envelope, foundations — are most exposed, and to which hazards.
Adaptation recommendations
Practical maintenance, design or renovation pathways that could improve the property's resilience and rating over time.
Built on national & international hazard datasets
Our Climate Risk Engine references government flood mapping, bushfire attack level standards, digital elevation and coastal inundation models, soil reactivity mapping, severe wind zoning, and IPCC AR6 climate projections across SSP1 to SSP5 emissions pathways.
Have a question about how we calculate risk?
Our team is happy to walk through the methodology in detail — particularly useful for lenders, insurers and valuers evaluating our reports.